Interesting Guardian article here with research into why people vote against same sex marraige. It's not just about religion...
Gay marriage: three key factors behind voting for bans
With high levels of religious adherence, North Carolina voters followed a predictable pattern. But that's not the whole story
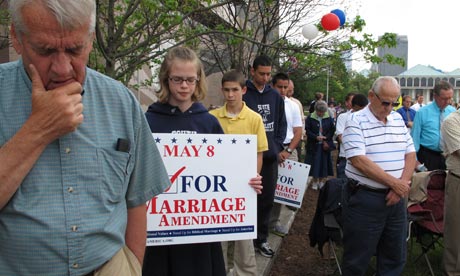
North Carolina voters passed a constitutional ban on same-sex marriage and civil unions Tuesday night. The reaction in the Twitterverse can be described as anger and hurt. Many probably thought to themselves that such a decision by the voters was "backward".
I have discussed how voter opinion on same-sex relationship issues is complex, but there isn't anything difficult to understand why Amendment 1 or any other constitutional ban on same-sex marriage pass.
Support for bans between states is highly predictable simply by knowing the percentage of religious voters. Many times, however, what explains differences between states' support does not explain how votes differ within a state.
Two years ago, I ran a simple regression on three recently voted-upon ballot bans on same-sex marriage in Arizona (2006), California (2008), and Maine (2009). I wanted to examine whether the percentage of religious adherents, taken from the Association of Religion Data Archives (ARDA), within a state could explain county-to-county variance in support of marriage bans. I also added variables for partisanship (as measured by Obama's 2008 vote percentage) and for educational attainment (as measured by the percentage of voters within each county with at least a bachelor's degree, according to census figures).
What I found many would call predictable: 89-93.5% of the variation in vote for same-sex marriage amendments could simply be accounted for these three variables.
Counties were less likely to vote for a ban if their voters were better-educated, more Democratic, and less religious. Importantly, equations such as these control for the fact that some counties might be quite Democratic and less religious, but have a high percentage of less well educated folk. In that case, these counties are more likely to vote for the ban than those counties that are highly Democratic, less religious, but (on average) more highly educated.
Continues here.
No comments:
Post a Comment